The Cosine and Sine Curves: \(y=cos(x)\) & \(y = sin(x)\)
(How to draw them and what their properties are)
The cosine and sine curves, written: \[y = cos(x)\quad \text{and} \quad y = sin(x)\] Show us how the value of
- \(y=cos(x)\) shows us the horizontal coordinate
The Cosine Curve, \(y = cos(x)\)
Remembering the definition of cosine, with a unit circle, the cosine curve \(y=cos(x)\) corresponds to the horizontal coordinate of a point moving around a unit circle.
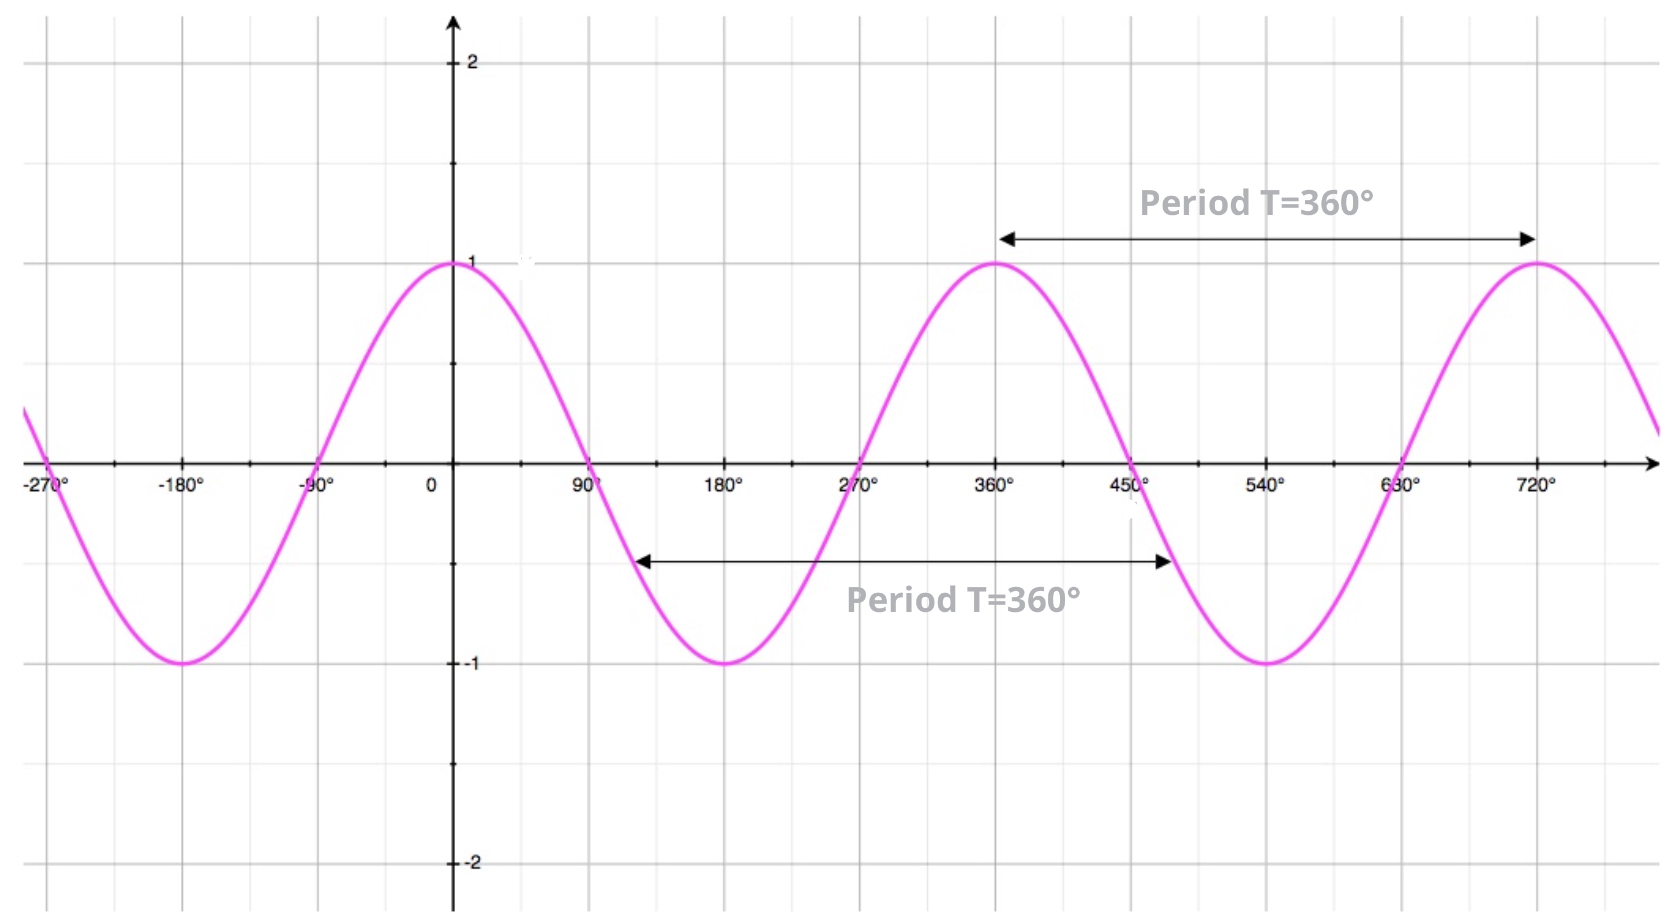
Looking at the cosine curve \(y=cos(x)\) we can see quite clearly that
- it oscillates between its minimum value \(-1\) and maximum value \(1\). This confirms the fact that the range of \(cos(x)\) is: \[-1 \leq cos(x) \leq 1\]
-
it is periodic, with period \(T = 360^{\circ}\).
Indeed no matter which point we look at on the curve: its - It reaches its maximum value \(cos(x) = 1\) when \(x=0^{\circ}, 360^{\circ},720^{\circ}, \dots\).
- It equals to zero \(cos(x) = 0\) and cuts the \(x\)-axis when \(x=90^{\circ}, 270^{\circ},450^{\circ}, \dots\) (all \(x\)-intercepts are \(180^{\circ}\) apart from each other).
The Sine Curve, \(y = sin(x)\)
Remembering the definition of sine, with a unit circle, the sine curve \(y=sin(x)\) corresponds to the vertical coordinate of a point moving around a unit circle.
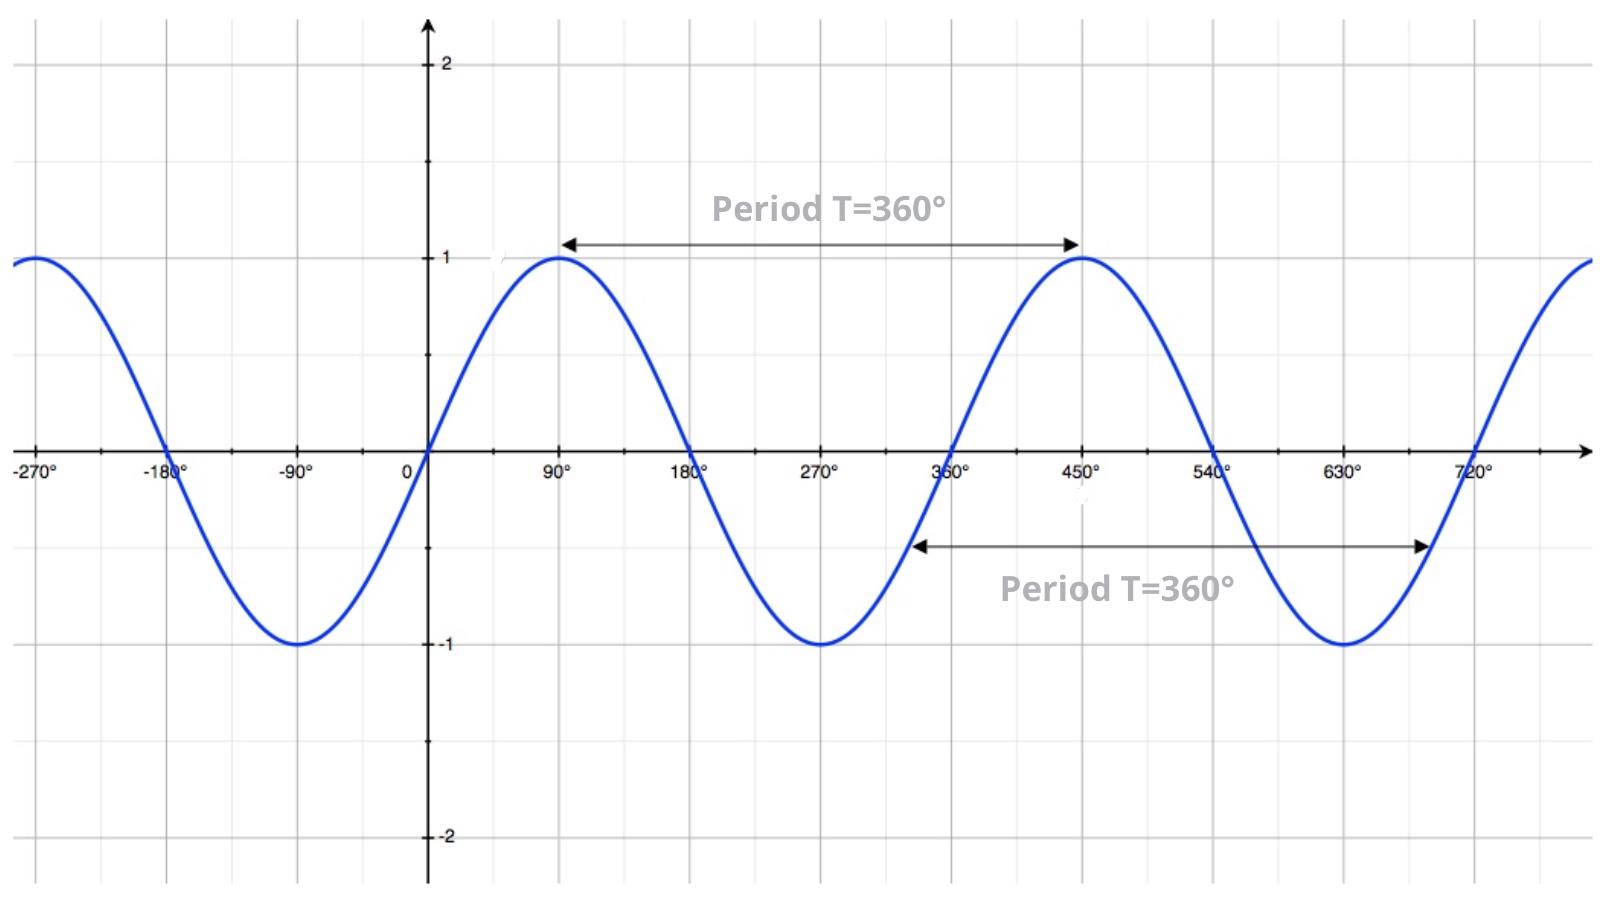
Looking at the sine curve \(y=sin(x)\) we can see quite clearly that
- just like the cosine curve: it oscillates between its minimum value \(-1\) and maximum value \(1\). This confirms the fact that the range of \(sin(x)\) is: \[-1 \leq sin(x) \leq 1\]
-
it is periodic, with period \(T = 360^{\circ}\).
Indeed no matter which point we look at on the curve: its - It reaches its maximum value \(cos(x) = 1\) when \(x=90^{\circ}, 450^{\circ},810^{\circ}, \dots\).
- It equals to zero \(sin(x) = 0\) and cuts the \(x\)-axis when \(x=0^{\circ}, 180^{\circ},360^{\circ}, \dots\) (all \(x\)-intercepts are \(180^{\circ}\) apart from each other).
Method: Sketching \(y=cos(x)\) & \(y=sin(x)\)
To sketch both \(y=cos(x)\) and \(y=sin(x)\) the idea is to plot:
- points at which the curve reaches the maximum height of \(1\). For \(y=sin(x)\): that'
- points at which the curve reaches the minimum height of \(-1\),
- points at which the curve cuts the \(x\)-axis.
This method is best explained in the tutorial below.
Tutorial 2: how to draw the sine curve \(y = sin(x))
Exercise
Answers Without Working