Introduction to Probabilities
Definitions & Key Terms
Probabilities are the study of "chance". When we calculate the probability of something occurring we are calculating the likelihood of it happening.
Studying probabilities will allow us to answer questions like:
What is the probability of winning the lottery?
What is the probability of picking two red balls from a bag with \(4\) red balls and \(6\) green balls?
What is the probability that it will rain in Ireland on Febrary \(14^{\text{th}}\)?
Before answering such questions we need to learn some terminology related to probabilities, this is simply to know how to express ourselves in this topic.
Definition - Experiment & Outcomes
In probabilities, an experiment is a process (could be "anything") in which there are one or more (usually more) possible outcomes each of which depends on chance.
Example
Here we show a couple of examples that show an experiment along with their outcomes.
- For example rolling a dice is an experiment in which there are \(6\) possible outcomes: \[1, \ 2, \ 3, \ 4, \ 5, \ 6 \]
-
Another example of an experiment could be: picking a ball, at random, from a bag that contains \(4\) red balls and \(6\) green balls. In this experiment there would be two possible outcomes:
Red or Green
Definition - Sample Space
Given an experiment, the sample space consists of all the possible outcomes of the experiment.
The sample space is usually written, or illustrated, using one of the following:
- a list of all the possible outcomes written inside a set that we call \(U\), or \(S\),
- a sample space diagram, or
- a Venn Diagram.
Example
- If we're flipping a coin the sample space would be: \[U = \left \{ \text{Heads}, \ \text{Tails} \right \}\]
- If we're rolling a dice, then the sample space would be: \[U = \left \{ 1, \ 2, \ 3, \ 4, \ 5, \ 6 \right \}\] Note: we'll be learning about sample space diagrams and Venn diagrams in the next sections.
Exercise 1
Write the sample space for each of the experiments, listed below.
- Picking a ball at random from a bag tha contains \(3\) green balls, \(4\) red balls and \(3\) yellow balls.
- Spinning a wheel numbered \(1, \ 2, \ 3, \ 4\) and guessing the number on which it will stop spinning.
- A class has \(7\) different nationalities in it: Swedish, American, English, French, Lebanese, Italian and Russian. A student is taken at random from the class and we have to guess his/her nationaility.
Definition - Single Events
Given an experiment, along with its possible outcomes, an event is the name given to either one of the possible outcomes, or a group of outcomes.
Events are usually referred to using a capital letter, such as \(A\), \(B\), \(C\), ... .
Example
The following show a couple of examples of single events.
-
Single Event
When we roll a single dice, we may define the event \(A\) as:\(A\): rolling an even number. in which case there are three outcomes that correspond to event \(A\):\(2,4,6\) - Single Event Another example could be when picking a ball at random from a bag containing \(4\) red balls and \(6\) green balls.
Definition - Combined Events
At times we'll be interested in the comination of two, or more, single events.
For instance, given two events \(A\) and \(B\) we may be interested in the event "\(A\) and \(B\)" or the event "\(A\) or \(B\)"
Example
When picking a card at random from a deck of \(52\) playing cards, we may be interested in the likelihood of picking a card that is both: even and red.
In this case we could define both events:
\(R\): the card is Red.
Definition - Probability
A probability is a number expressed as either:
- a Decimal
- a Fraction
- a Percentage
Notation
Given an event \(A\), the probability of event \(A\) occurring is written: \[p\begin{pmatrix}A \end{pmatrix}\] Read: "the probability of event \(A\)"
The likelihood of an event \(A\) occuring is measured on a scale that goes from \(0\) to \(1\), where:
- \(0\) is the probability of somthing impossible.
- \(1\) is the probability of something certain.
The following illustration gives us an idea of how probabilities are measured:
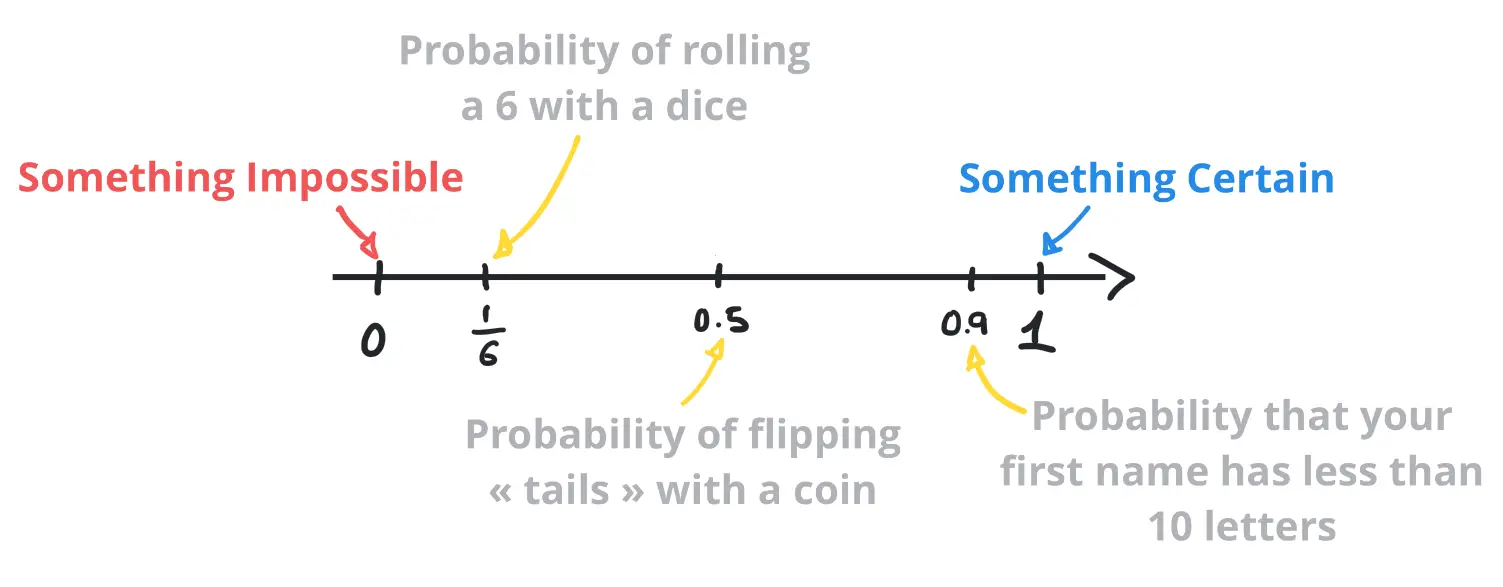
All probabilities fit somewhere on this scale (no exceptions), where:
Fundamental Result for Probabilities
Given an event \(A\), the following result will always be true: \[0 \leq p\begin{pmatrix}A\end{pmatrix} \leq 1\] Note: this result is important, make a note of it. If ever, in your calculations, you find a probability greater than \(1\), or less than \(0\), you have done something wrong. Go back and check your working.
Tutorial
Exercise
-
Try representing each of the following events on the same probability scale:
- Event \(A\): picking a red ball that contains \(1\) green ball and \(9\) red balls.
- Event \(B\): rolling three \(6\)'s in a row, when rolling a single dice \(3\) times.
- Event \(C\): rolling an even number with a dice.
-
Write each of the following probabilities in the two missing forms (decimals, fractions, or percentages):
- \(p\begin{pmatrix} A \end{pmatrix}= 0.2\)
- \(p\begin{pmatrix} A \end{pmatrix} = 30 \%\)
- \(p\begin{pmatrix} A \end{pmatrix} = \frac{3}{4}\)
-
Define an event \(A\), which has each of the following probabilities:
- \(p\begin{pmatrix} A \end{pmatrix} = 0\)
- \(p\begin{pmatrix} A \end{pmatrix} = 1\)
- \(p\begin{pmatrix} A \end{pmatrix} = 0.5\)
Answers Without Working